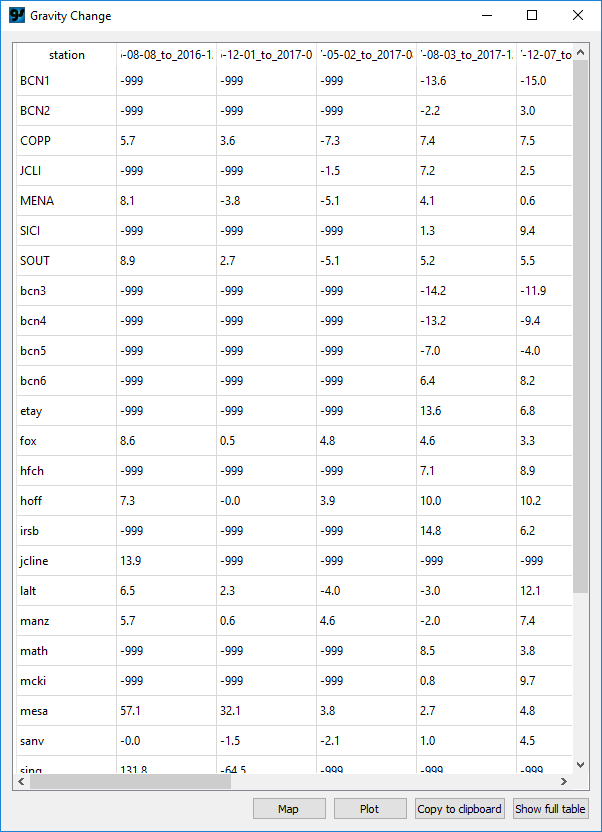
If two or more Surveys are present in a Campaign, GSadjust can calculate the change in gravity over time using the Process > Compute gravity change menu option. This opens a new window that displays a table of gravity change:
Three table formats are selectable from the drop-down list:
Simple: Includes gravity change is calculated between each successive survey, and cumulative change is calculated from the first survey. One row per station.
Full: Includes station coordinates, adjusted gravity values and standard deviation, and gravity change converted to meters of water. One row per station.
List: Includes station name, date, adjusted gravity value, and standard deviation. One row per station per survey.
To export results, select cells in the table (Ctrl-a to select all), and select the "Copy to clipboard" button at the bottom of the table.
The complete table can also be exported by selecting the Tools > Write tabular data menu option.
Gravity-change time series can be plotted with the Plot and Map buttons.
The contents of Calculating gravity change over time