The continuous-model drift correction treats model drift as a continuous function. The main advantage over the network-adjustment drift correction is that it allows a non-linear spline model, which is often the best fit for survey data recorded using a ZLS Inc. Burris relative-gravity meter (in contrast, Scintrex meters typically have higher, more linear drift rates).
The continuous drift model is developed from repeated station occupations (that is, when a station is visited more than once, with other stations occupied in between). Each station-repeat provides one observation of relative-meter drift. Ideally, repeats will occur with relatively little elapsed time between, over a period when the drift is nearly linear. As the length of time between station repeats increases, drift is likely to become increasingly non-linear, and the drift estimate less suitable for forming the continuous drift model. The elapsed time can be visualized on the continuous-drift plot with the "Show time extent of drift observation" option under Plotting options.
Successful application of the continuous-model drift correction depends on accurate observations of gravity-meter drift, which in turn depends on repeat occupations with minimal elapsed time in between. To accomplish that, it may be necessary to adapt the survey design. In particular, observing stations in loops (i.e., visiting 5 or 6 stations before returning to the initial station) may allow too much time to elapse for a representative drift estimate to be obtained.
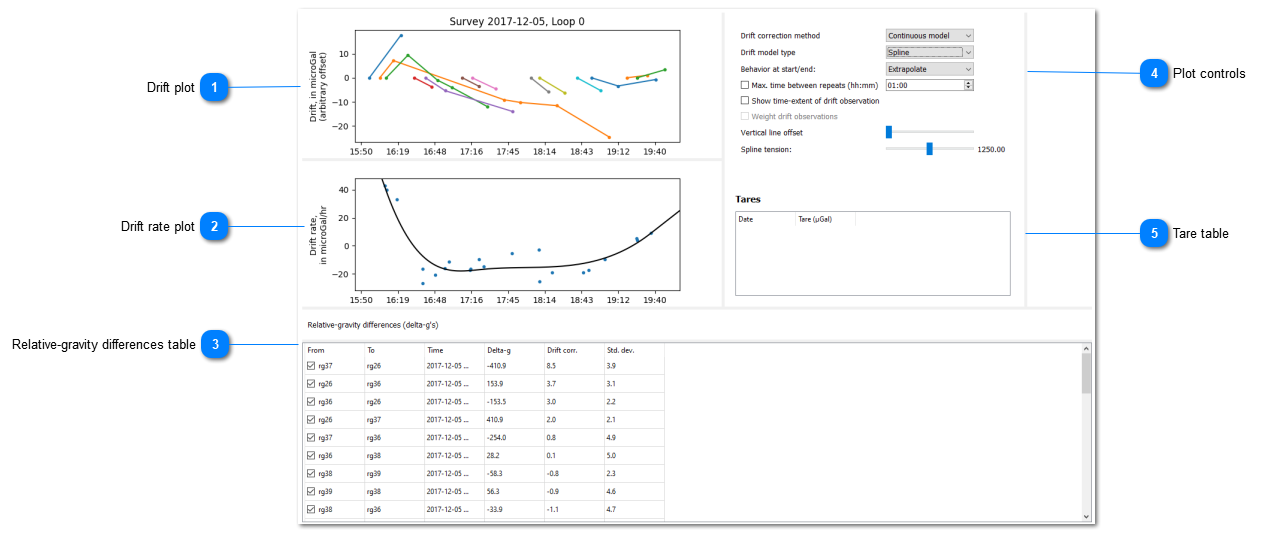
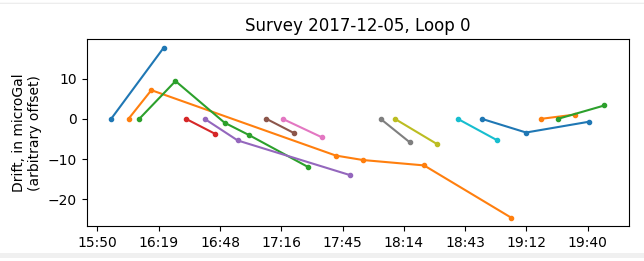
Drift plot
This plot shows the change in gravity at each station, relative to the initial occupation at that station. Each line depicts a unique station. Steeper lines (positive or negative) indicate a larger drift rate. The points that make up each line can be filtered using the "Max. time between repeats" option. A vertical offset between each line can be added with the "Vertical line offset" slider control.
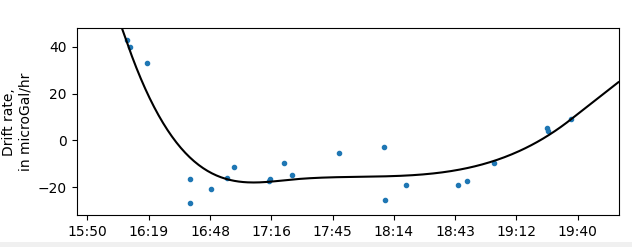
This plot shows the drift rate, calculated each time a station is repeated. Each point in this plot represents the slope (i.e., the drift rate) of the line directly above in the drift plot.