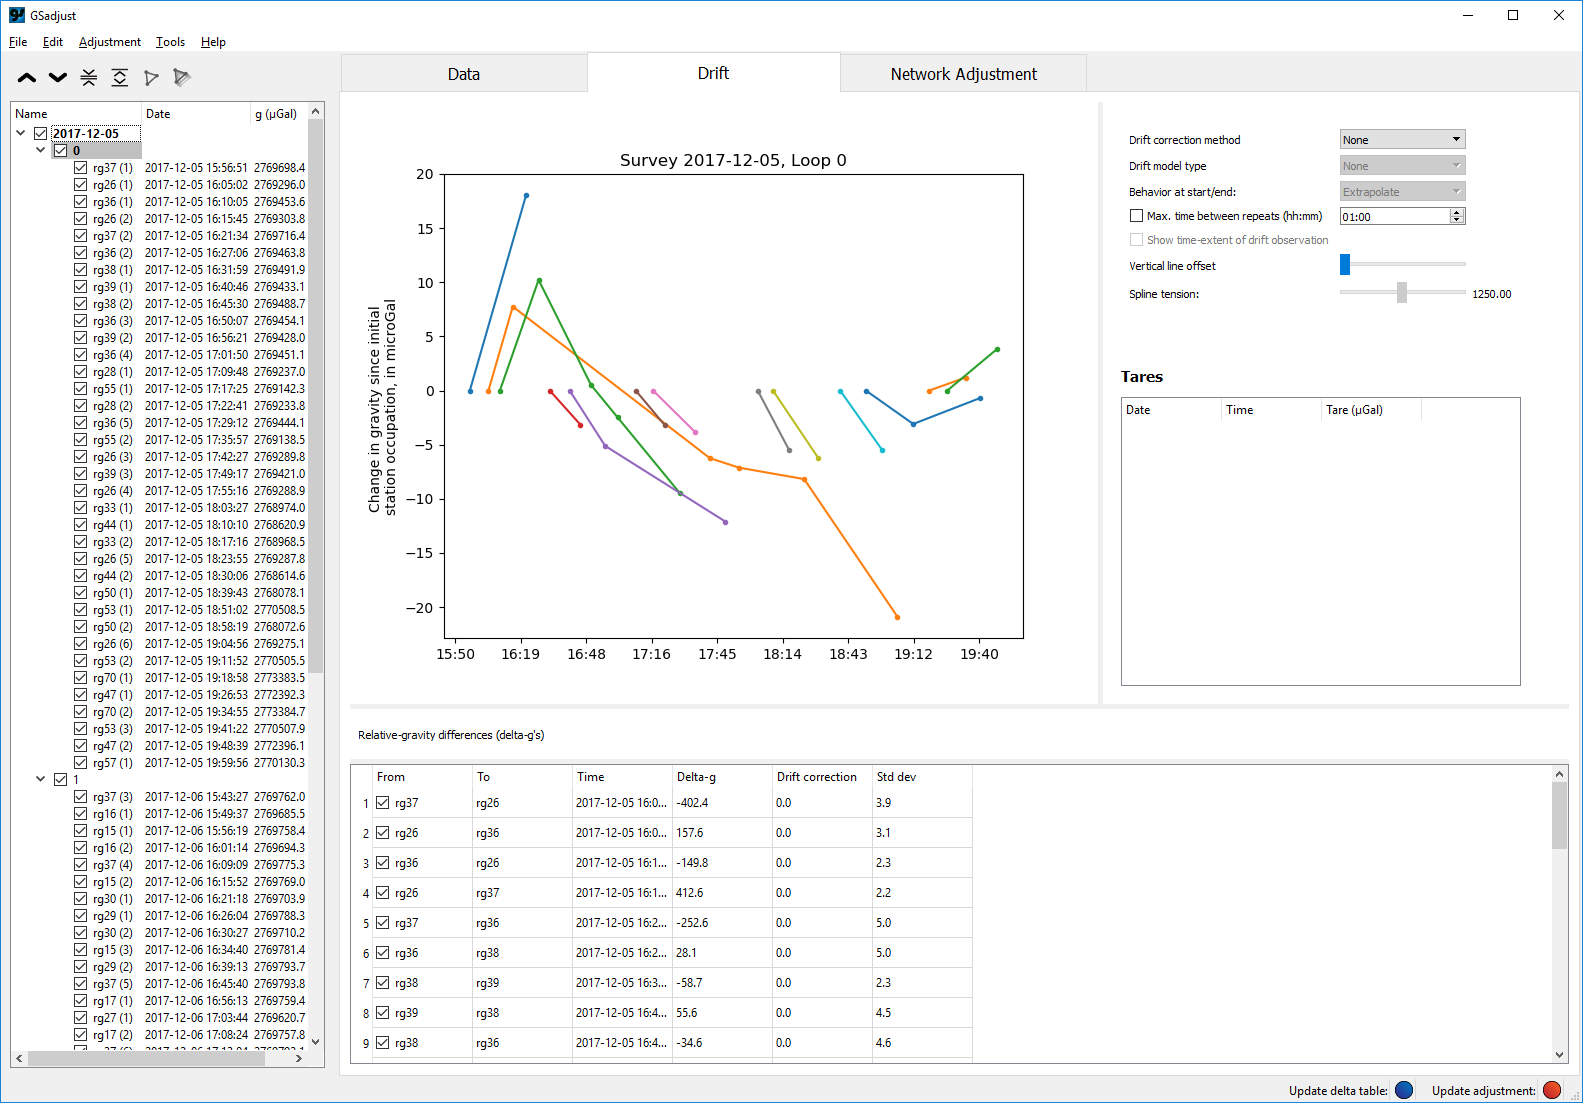
The drift correction method is selected in a dropdown box on the right sight of the drift window. The plots and tables shown on the drift tab can vary depending on the drift correction method. For the no correction, network-adjustment , and Roman method options, a plot of gravity change vs. time at each station is shown. For the continuous method option, an additional plot of drift observations vs. time is shown. For the no correction, network-adjustment, and continuous method options, a single table of gravity differences (Delta-g's) is shown, along with relevant details. Delta-g's are only calculated between successive stations. For the Roman method option, two tables are shown: one with all possible Delta g's, and another with average Delta-g's (where more than one Delta-g exists between two stations).