The Roman (1942) method interpolates a gravity value when there is more than one gravity observation at a station. A total of three station occupations-two at one station, and one at an additional station-are used to calculate a delta-g sample [Item (2) below)]. An interpolated value is calculated for the station with two occupations, and differenced with the measured value at the other station, to calculate delta-g.
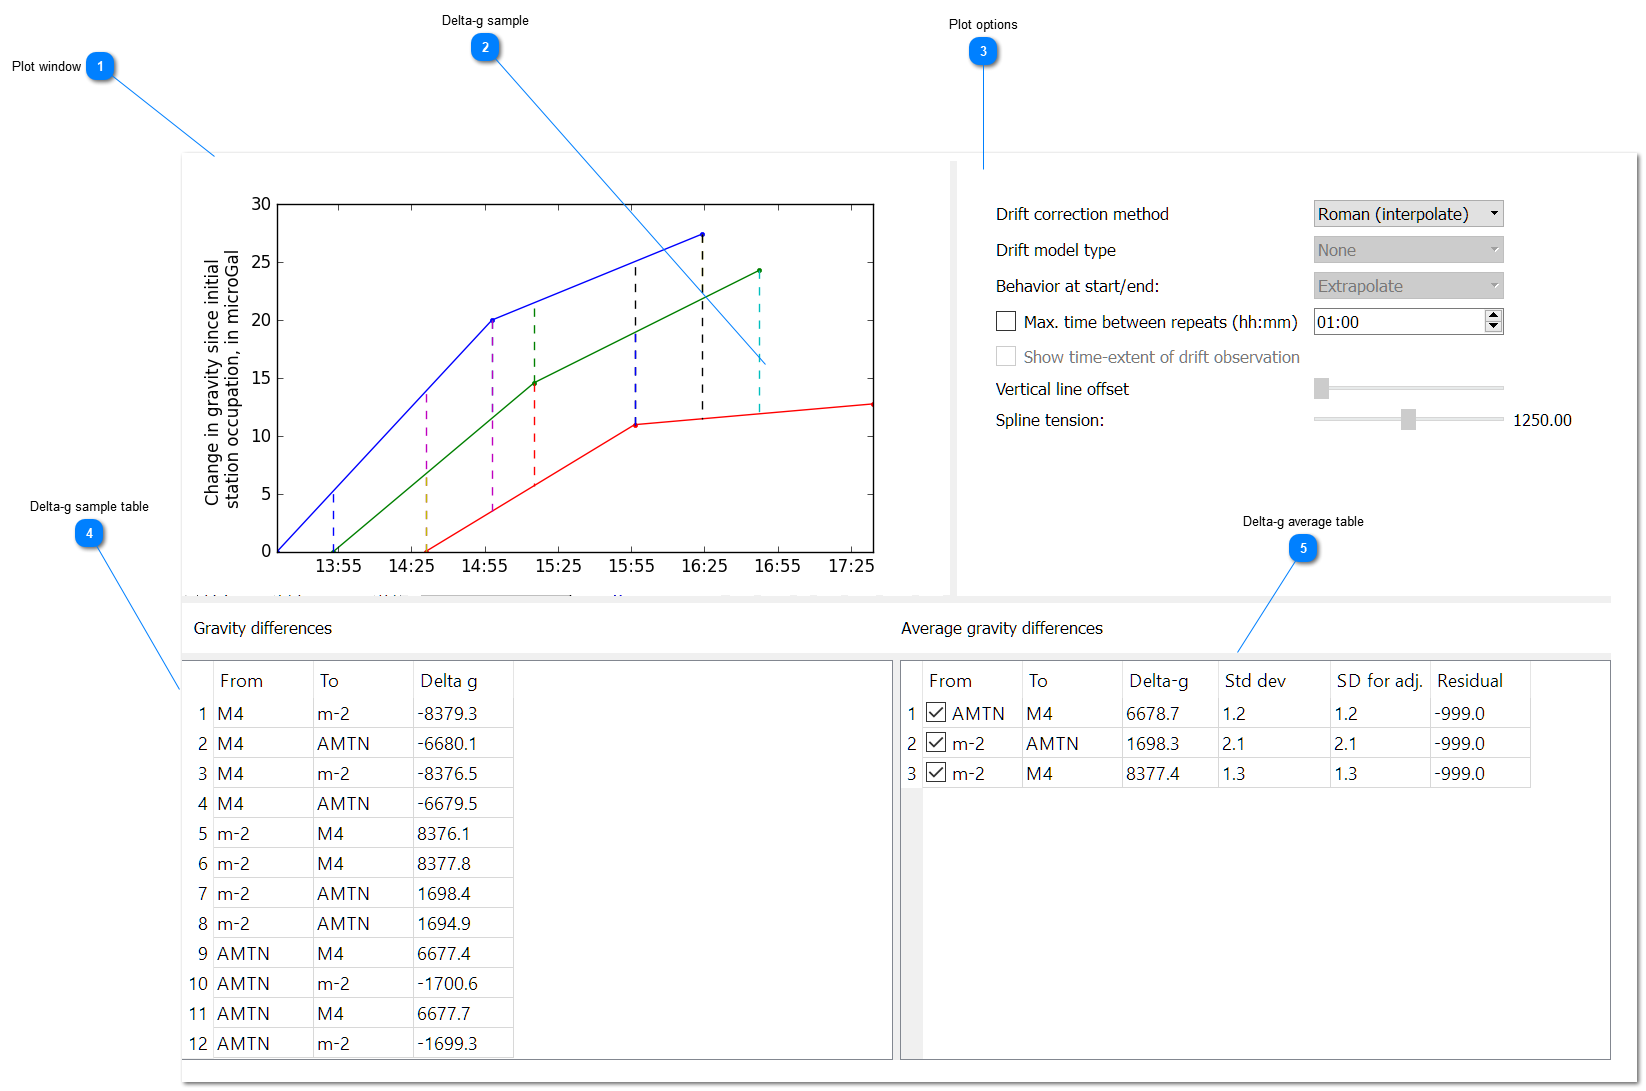
In the window below, delta-g's are shown as vertical dashed line. Each measurement is shown relative to the first measurement at that station (in other words, if the measured values were plotted, the solid lines would have a vertical separation equal to the gravity difference between the stations). For the survey shown, which consists of two complete loops at three stations, there are a total of 12 delta-g's, shown on the Delta-g sample table (4).
As part of the Roman method drift correction, the redundant delta-g's (12 obserations are possible, but only 3 are required to identify a gravity value at each station) are averaged. The averaging process is a simple form of network adjustment, with equal weight given to all observations. For surveys and/or campaigns with only a single loop (including vertical gradients), the values in the Delta-g average table (5) can serve as final results.
Plot window
The main plot window shows the relative-gravity observations at each station, relative to the first occupation at that station.
Each vertical dashed line represents a delta-g calculated using the Roman method. There is a corresponding entry in the Delta-g sample table for each dashed line.
This table displays the average delta-g between any two stations in the Delta-g sample table. If there is only one delta-g between two stations, it will also be included in the average table.
Roman, I. (1946). An observational method to overcome zero drift error in field instruments. Geophysics, 11(4), 466–490. https://doi.org/10.1190/1.1437276