GSadjust User Guide
×
Menu
  • 3. Data tab

3. Data tab

 
The data tab provides functions for viewing samples at each station occupation and tools for selecting/deselecting samples based on quality criteria.
 
3. Data tab
1

Data Tree View

  The Data Tree View shows the hierarchical structure of the data set, and is common to all tabs.
 
2

Data Table

  •   The Data Table shows all of the samples for a particular station occupation. The columns vary depending on the meter type:
    Burris
    Scintrex
    Station name
    Station
    Operator
    Gravity (g)
    Meter number
    Standard deviation
    Date/time
    Tilt x
    Gravity (g)
    Tilt y
    Dial setting
    Temp
    Feedback
    Duration
    Tide correction
    Rejected
    Elevation
    Elapsed time
    Latitude
    Date/time
    Longitude


3

Data Plot Window

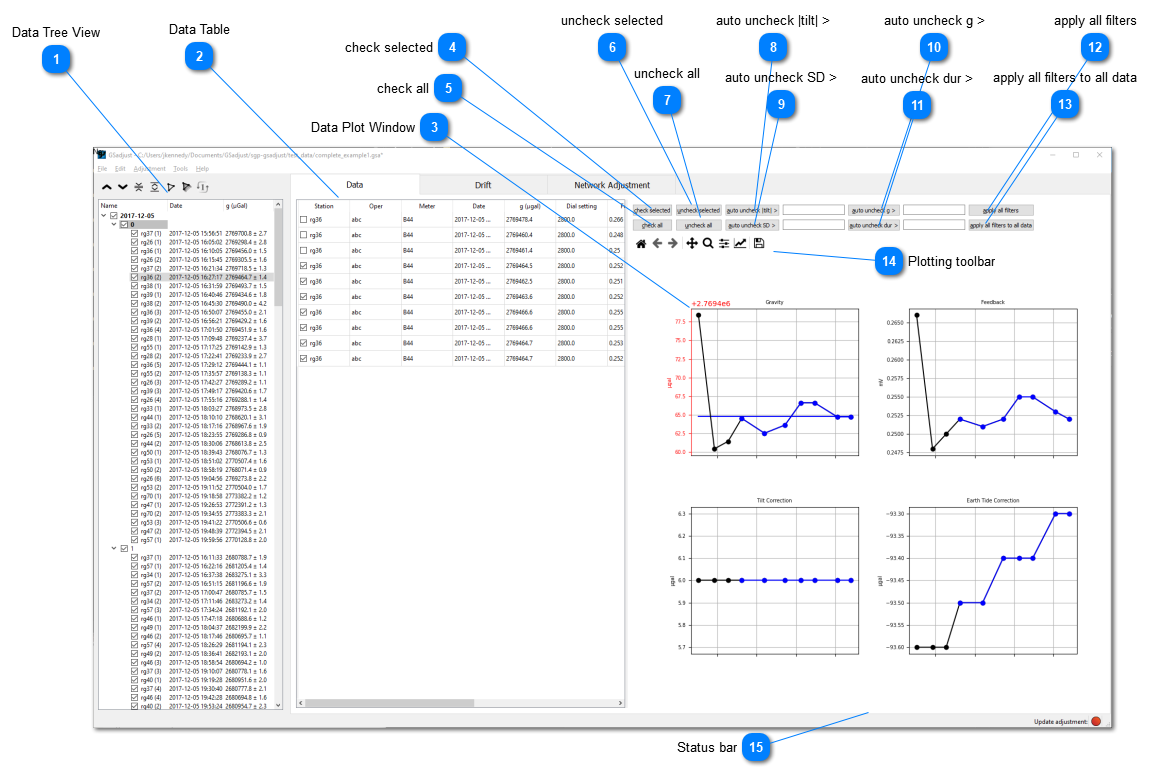
The Data Plot window shows graphically the gravity value and accompanying data for a particular station occupation. For the Burris meter, the plots shown are gravity, feedback, tilt correction, and Earth tide correction. For the Scintrex meter, the plots shows are gravity, Tilt X, Tilt Y, and standard deviation.
 
On the gravity plot, if the y-axis range exceeds 20 µGal, the axis is shown in red. Otherwise the y-axis range is 20 µGal and the axis is shown in black.
 
4

check selected

4. check selected
Rows in the Data Table can be selected using the mouse; multiple rows can be selected by holding down the shift or control keys. If unchecked rows are selected, this button checks them.
5

check all

5. check all
Checks all rows in the Data Table.
6

uncheck selected

6. uncheck selected
Rows in the Data Table can be selected using the mouse; multiple rows can be selected by holding down the shift or control keys. If checked rows are selected, this button unchecks them.
7

uncheck all

7. uncheck all
Unchecks all rows in the Data Table.
8

auto uncheck |tilt| >

8. auto uncheck |tilt| >
Unchecks observations with abs(tilt) (X or Y) greater than the specified value. Used only for Scintrex data.
9

auto uncheck SD >

9. auto uncheck SD >
Unchecks observations with standard deviations greater than the specified value. Used only for Scintrex data.
10

auto uncheck g >

10. auto uncheck g >
Unchecks observations with g values that differ from the mean by more than the specified value.
11

auto uncheck dur >

11. auto uncheck dur >
Unchecks observations with durations longer than the specified value. Used only for Scintrex data.
12

apply all filters

12. apply all filters
Applies any thresholds for tilt, g, standard deviation, or duration to all samples of the current station occupation.
13

apply all filters to all data

13. apply all filters to all data
Applies any thresholds for tilt, g, standard deviation, or duration to all stations in the Campaign.
 
WARNING: This can be very slow for large datasets.
14

Plotting toolbar

14. Plotting toolbar
This is the standard Matplotlib (plotting utility for Python) tool bar. More info is under the Plot toolbar heading.
15

Status bar

15. Status bar
 
The status bar at the bottom of the window shows messages about the current processing status.