Data are selected or deselected using checkboxes. In the Data tree view, surveys, loops, or stations may be selected or deselected. In the station table, individual samples may be selected or deselected. By default, all of the samples, stations, loops, and surveys are selected after importing.
Individual samples at a station occupation may also be selected/deselected using the criteria described on the Data tab page.
Data plots
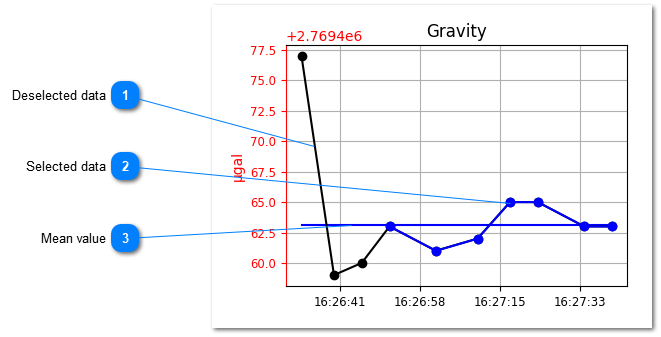
In the station data view, the currently selected samples are shown with blue markers. Deselected samples are shown with black markers. The mean value of the selected data is shown as a horizontal solid blue line.
On the Gravity plot only, the y-axis color is changed to red if the range is larger than µGal. Otherwise, the range is 20 µGal and the axis is shown in black.
Deselected data
Data are deselected by unchecking the text box in the Station table. Deselected data are shown in black.